
Building a Two-Node LLM Inference Cluster on NVIDIA GX10 (GB10)
I wanted to know what it actually takes to run a serious coding model on hardware I own. Not a 7B toy that fits on a laptop, but something in the class you would reach for at work, served over an API my own tooling can talk to.
So: two NVIDIA GX10 boxes, 40,000 zł for the pair, about $10,800 at the NBP rate of 3.7103, and a list of things I did not know how to do. How do you split a 230B model across two machines? What interconnect does that actually need, as opposed to what the marketing says it needs? Which quantisation fits in the memory you have? And the question nobody prints on the box: once it runs, what decides how fast it goes?
The first working configuration did 25 tok/s, and not even steadily. Run the same benchmark four times and you get 19, 24, 28, 22.
It does 40.4 now, repeatably. The difference was one environment variable I had set myself, for a reason that turned out to be wrong.
Most of what I learned had nothing to do with the model. It was about fitting weights into the memory you actually have, picking a transport, and then accepting a ceiling that no amount of tuning moves. If you are thinking about building something similar, those three things are the ones that matter, and the rest of this is how I found that out the slow way.
The model I planned the whole thing around did not exist
The plan was a specific HuggingFace checkpoint, an abliterated Qwen3.5 MoE. The model card documented a full GGUF quantisation suite, Q3_K_M through Q8_0, with a download table and Ollama instructions.
None of those files were on the repo.
$ curl -s ".../api/models/<repo>/tree/main/gguf"
ERROR: gguf does not exist on "main"
$ curl -sIL ".../resolve/main/gguf/<model>-Q8_0.gguf" | head -1
HTTP/2 404
Only the bf16 safetensors had actually been uploaded, 21 shards, about 65 GB. Check the API before you plan around a model card, not the prose on the page.
Ollama then found the GB10 and refused it, logging that compute capability 1210 was not in its compiled architecture list. That one turned out to be harmless noise. It probes a CUDA 12 runner, fails, falls through to a bundled CUDA 13 runner, and works. Worth knowing separately: OLLAMA_VULKAN defaults to on, and you do not want the Vulkan path on this GPU.
Then I spent an embarrassing amount of time on this:
pkill -f 'ollama serve' # kills its own parent shellEvery attempt to background the server died with exit code 144. pkill -f matches full command lines, including the command line of the shell running pkill, which contains the string ollama serve. It killed itself, every time. Kill by PID from pgrep -x.
The real problem with that checkpoint was structural. The config declared Qwen3_5MoeForConditionalGeneration, a multimodal architecture with a vision tower, but every tensor in the file sat under model.language_model. and there were zero vision tensors. vLLM crashed building an image processor for images that could never arrive. The fix is a genuinely useful trick:
--hf-overrides '{"architectures":["Qwen3_5MoeForCausalLM"]}'
vLLM's text-only class exists for exactly this case. It remaps the prefix and skips the vision tower.
Two boxes, one fabric, and cables that were not where I assumed
Each GX10 has 128 GB of unified LPDDR5X, about 121.6 GiB visible, at roughly 273 GB/s. CPU and GPU share one pool, which is why nvidia-smi cheerfully reports no GPU memory at all. There is no separate VRAM to report.
Both ConnectX-7 ports showed carrier at 200000 Mb/s and no IP addresses. Two traps followed.
The cables were cross-connected. Assuming a straight pairing gave me ARP INCOMPLETE and 100% loss until I actually traced them. And setting MTU right after adding the address silently drops the connected route, so the order has to be: link up, set MTU, then add the address.
Once configured, a single TCP stream did 43.9 Gb/s, eight parallel streams did 111 Gb/s with zero retransmits, jumbo frames passed, RTT about 0.4 ms.
Multi-node vLLM needs Ray, and the vLLM nightly image ships without it, so I built a thin derived image and shipped it node to node over the new fabric. Image choice mattered more than I expected: the stock NVIDIA vLLM container ships vLLM 0.13, which has never heard of these architectures. The nightly gave me 0.26.1 with torch 2.13+cu130 matching the driver.
Why do the two boxes need to talk at all? Because of tensor parallelism. The model is cut down the middle, so each GPU holds half of every layer and computes half of every matrix multiply. Those halves have to be added back together before the next layer can start, and that sum across both machines is called an all-reduce. NCCL is NVIDIA's library for performing it. This model does 124 all-reduces for every single token it emits, which is why the link between the boxes ends up mattering as much as the boxes.
What comes out the other side is this:
The rails cross: the upper port on one node lands on the lower port of the other. Assuming a straight pairing is what produced ARP INCOMPLETE and 100% loss, and it is why NCCL_CROSS_NIC=1 is in the configuration.
Picking a model that fits
Model selection here is mostly arithmetic. Two nodes at 121.6 GiB, running at --gpu-memory-utilization 0.80, leaves about 194 GiB for weights, KV cache and activations together. That number decides everything else.
Quantisation is what decides whether a model fits in it. Weights come out of training at 16 bits each, and a quantised build stores them with fewer: AWQ 4-bit uses roughly a quarter of the space, trading a little accuracy for a model that loads at all. The format names in the chart below run in order of precision and size, from 4-bit AWQ and NVFP4, through 8-bit MXFP8, up to full bf16.
The budget is roughly 194 GiB for weights, KV cache and activations. Only the 4-bit MiniMax-M2.7 fits, and it is the newest MiniMax that does.
Show the numbers as a table
| Item | Size on disk |
|---|---|
| GLM-5.2 | 1,507 GB (scores higher, never an option) |
| MiniMax-M3 bf16 | 854 GB |
| MiniMax-M3 MXFP8 | 444 GB |
| MiniMax-M3 NVFP4 | 250 GB |
| MiniMax-M2.7 AWQ 4-bit | 122 GB (chosen) |
So the winner is MiniMax-M2.7 at AWQ 4-bit: 122 GB, 230B total parameters with about 10B active per token, 56.22% on SWE-bench Pro and tenth on SWE-bench Verified. It loads in about five minutes and I serve it at 131,072 context, though the model itself supports 204,800.
The honest part of that table is GLM-5.2. It scores better, 62.1% against 56.2%, and at 1,507 GB it was never going to happen. Buying hardware means picking from the models that fit it, not the models you want.
One thing surprised me. A smaller dense model would be slower here, not faster. Dense models read every parameter for every token, so a 27B dense model pulling ~28 GB per token tops out near 10 tok/s on a single node. The MoE reads ~2.65 GB per node per token, which is why a 230B model beats a 27B one on the same boxes. The mixture-of-experts architecture is the entire reason the cluster is worth having.
The flag that cost me 58%
Some terminology first, because the whole story turns on it. RDMA is remote direct memory access: the network card writes straight into the other machine's memory, with no kernel copying buffers and no process being woken to receive anything. That is where microsecond latencies come from. RoCE is RDMA over Converged Ethernet, the same idea carried on ordinary Ethernet cabling rather than InfiniBand, and RoCEv2 is the routable version that rides on UDP/IP. GPUDirect RDMA is a third, narrower thing: the NIC writing directly into GPU memory instead of bouncing through system RAM first.
Three different features with overlapping names. Confusing two of them is what follows.
I had set NCCL_IB_DISABLE=1, because I read a write-up saying GPUDirect RDMA is not supported on GB10.
That was a misreading, and an expensive one. GPUDirect RDMA means the NIC writing directly into GPU memory. Plain RoCE is a different mechanism and works fine on this hardware. My flag disabled the entire fast path and forced NCCL onto TCP sockets, which is why the numbers were both low and erratic.
The hardware had been ready the whole time. Four RoCE devices, sitting there in /sys/class/infiniband/, ignored.
Batch of 1, 512 tokens, warm run. The TCP figure moved between 19 and 28 between runs; the RoCE figure repeated at 40.17, 40.45, 40.36 and 40.38.
Show the numbers as a table
| Item | Decode throughput |
|---|---|
| NCCL forced onto TCP sockets | 25.0 tok/s |
| NCCL over RoCE | 40.4 tok/s |
Transport latency went from roughly 400 µs to 1.74 µs, and per-rail bandwidth from 43.9 Gb/s single-stream to 107.8 Gb/s. The run-to-run variance disappeared entirely, which I found more satisfying than the throughput.
The configuration that did it:
NCCL_IB_HCA=rocep1s0f0,roceP2p1s0f0
NCCL_IB_MERGE_NICS=1          # required to use BOTH NICs
NCCL_CROSS_NIC=1              # the cables are cross-connected
NCCL_IB_GID_INDEX=3           # RoCEv2
NCCL_IB_QPS_PER_CONNECTION=4
NCCL_SOCKET_IFNAME=enP7s7     # bootstrap only, on the management NIC
# and critically: do NOT set NCCL_IB_DISABLE
Containers need --privileged and -v /dev/infiniband:/dev/infiniband. Check for this line in the logs to confirm it engaged:
NET/IB : Using [0]rocep1s0f0:1/RoCE [1]roceP2p1s0f0:1/RoCE [RO]; OOB enP7s7
Ten things that did not help
Having found one 58% win, I assumed there were more. There were not. Every number below is measured on a warm run, because the first run after a load reads about 17 tok/s and will fool you if you let it.
Three more never produced a number: pipeline parallel (PP=2) died with an illegal instruction, fp8 KV cache failed at executor start, and dual-rail over TCP hung in NCCL init. NCCL_PROTO=LL reached 23 to 28 tok/s, but only while stuck on TCP.
Show the numbers as a table
| Item | Decode throughput |
|---|---|
| enable_sp + fuse_gemm_comms | 40.11 tok/s (noise) |
| Baseline: RoCE, Marlin, TP=2 | 40.00 tok/s |
| enable_qk_norm_rope_fusion | 39.67 tok/s |
| fuse_allreduce_rms | 39.65 tok/s |
| Pinned NCCL channels | 22.80 tok/s |
| Expert parallelism | 22.30 tok/s |
| NCCL_PROTO=LL128 | 18.20 tok/s |
| NVFP4 quantisation | 16.80 tok/s |
| MoE backend = Triton | 16.60 tok/s |
| n-gram speculative decoding | 15.90 tok/s |
Two of those deserve an explanation, because both look like free wins on paper.
Compile-time fusion does nothing here because all three fast all-reduce paths are unavailable on a pair of GB10s. The startup warnings say it plainly: device capability 12.1 unsupported for SymmMem, FlashInfer all-reduce disabled at world_size 2, custom collectives disabled without MNNVL multicast. vLLM falls back to plain pynccl for every collective, and fusion passes save kernel launches rather than network round trips.
MoE autotuning is a longer dead end. vLLM ships 332 tuned MoE configs and none of them are for GB10. Tempting, until you notice that the AWQ model runs through marlin_moe.py and only the Triton backend ever reads those files. Forcing the backend that does read them costs you 60% of your throughput to chase a tuning gain that might be 30%. Marlin was already the right answer.
Speculative decoding is the one that still annoys me. vLLM supports Eagle3MiniMaxM2ForCausalLM, but no Eagle3 or MTP draft checkpoint exists on HuggingFace for any MiniMax-M2.x. That is the 1.5 to 2x that everyone quotes, and it simply is not available for this model.
Where the 25 milliseconds actually go
For a while I read "GPU at 95% utilisation drawing only 25 W" as the cluster spinning on the network. Wrong again. High utilisation with low power is equally the signature of a memory-bound kernel, and this one is memory-bound.
At 40 tok/s, each token has a 25 ms budget. Measuring RDMA latency at the real all-reduce payload size, about 6 KB, gives 3.42 µs, so a 2-rank all-reduce with NCCL overhead lands near 15 µs. There are 124 of them per token.
Collectives are the entire network contribution: 1.86 ms of the 25 ms budget. Cross-check: the TCP to RoCE jump saved 15 ms across 124 collectives, which implies 121 µs saved each, so TCP was near 136 µs and RoCE near 15 µs. Two independent methods agree.
Show the numbers as a table
| Item | Time per token |
|---|---|
| Kernels, MoE routing, dequant, scheduler | 13.43 ms (53.7%) |
| Memory reads, 2.65 GB at 273 GB/s | 9.71 ms (38.8%) |
| Collectives, 124 × ~15 µs | 1.86 ms (7.4%) |
The interconnect I spent days fixing carries 7.4% of the token. A hypothetical zero-latency fabric would take me from 40 to about 43 tok/s. During inference the link runs at well under 1% of its 107 Gb/s capacity, which means every fabric tuning knob left on the table, PFC, DSCP, adaptive routing, QP splitting, fixes congestion this topology does not have.
So 40 tok/s is the ceiling for this model on this hardware. Only a different model moves it.
Watching it run, and three bugs that cost me
vLLM hands you 68 Prometheus metric families at :8000/metrics with no instrumentation of your own, which is the nicest surprise in the whole project. Prometheus and Grafana sit on node 1, with node-exporter, an nvidia-smi exporter and cAdvisor on both boxes. Seven scrape targets in total.
Everything here runs in containers, which is worth drawing once because the pieces are easy to mix up:
Only node 1 serves HTTP. Node 2 holds no API of its own: it exists to own half of every layer, which is why nothing answers on port 8000 there.
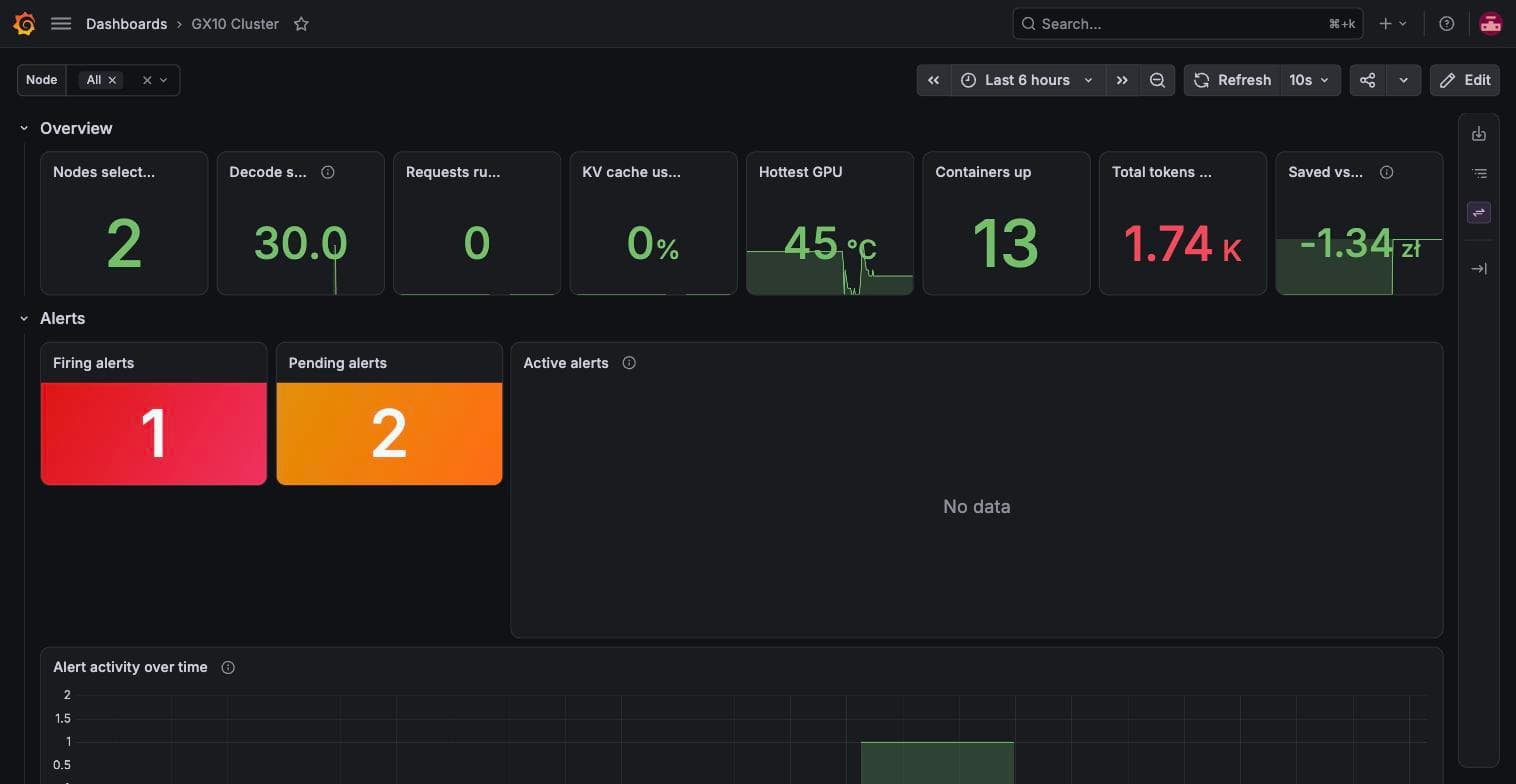
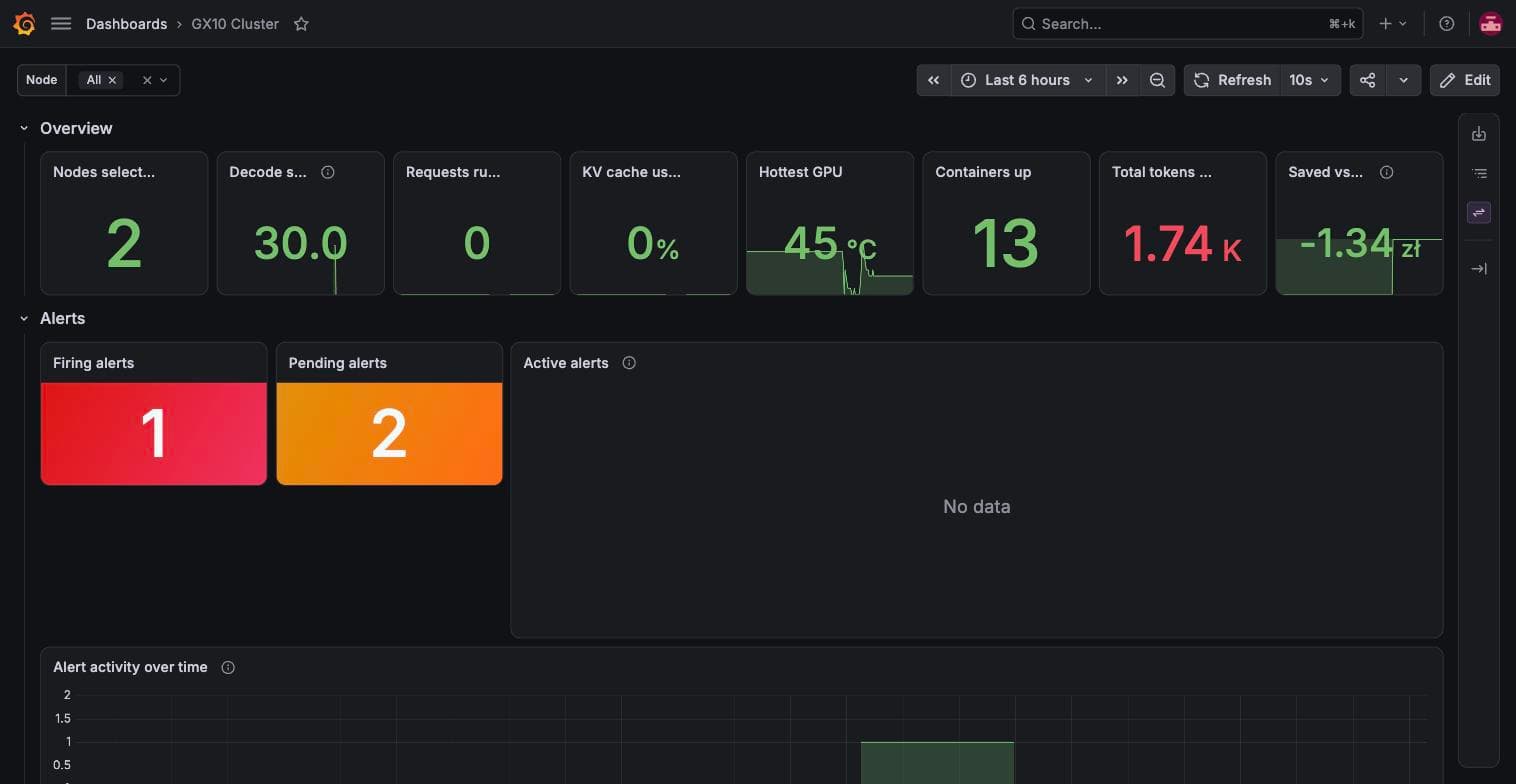 The overview row. Note the firing alert: that is VLLMDown, because the cluster was idle when I grabbed this.
Fifty-odd panels on a single page is unusable, so everything lives in collapsible rows with only the overview open, plus a node variable for looking at one box or both.
If you would rather start from mine than from a blank page, take it:
The GX10 cluster dashboard
All 22 panels: tokens and latency, GPU per node, RDMA fabric counters, NVMe health, containers, and the cost and amortisation rules. In Grafana go to Dashboards, New, Import, paste the JSON or upload the file, and pick your own Prometheus datasource when it asks. Panels for exporters you are not running come up empty rather than breaking the rest.
gx10-cluster-dashboard.json · 111 KBThree bugs were worth the trouble of finding.
The first: node-exporter hangs under RDMA load. The symptom was gaps in the system panels while the vLLM and GPU panels stayed continuous. Not slow scrapes, permanently stuck ones.
$ curl localhost:9100/metrics
Limit of concurrent requests reached (40), try again later.
Scrapes pile up at five second intervals and hit that ceiling within minutes. I bisected it to two collectors: infiniband on both nodes under RDMA traffic, and cpufreq on node 2 only. Disabling the defaults and naming a minimal collector set took a scrape from never finishing to about 5 ms.
The second: RoCE traffic is invisible to node_network_*. RDMA bypasses the kernel network stack, so under identical load netdev reported 120 KB while the RDMA port counter read 1.46 GB. Off by a factor of 12,000. Read /sys/class/infiniband/*/ports/1/counters/ instead, and remember the values are in 4-byte words. That is also how I confirmed the fabric carries about 0.8 Gb/s of its 107 Gb/s during inference, which is the independent check on the latency conclusion above.
The third is not a bug at all, which took me a while to accept. histogram_quantile over a rate with no requests in the window returns NaN, and Grafana draws NaN as a hole. I counted 31 of 31 NaN while idle, and real values the moment traffic ran. Check the request rate before you go hunting for an outage.
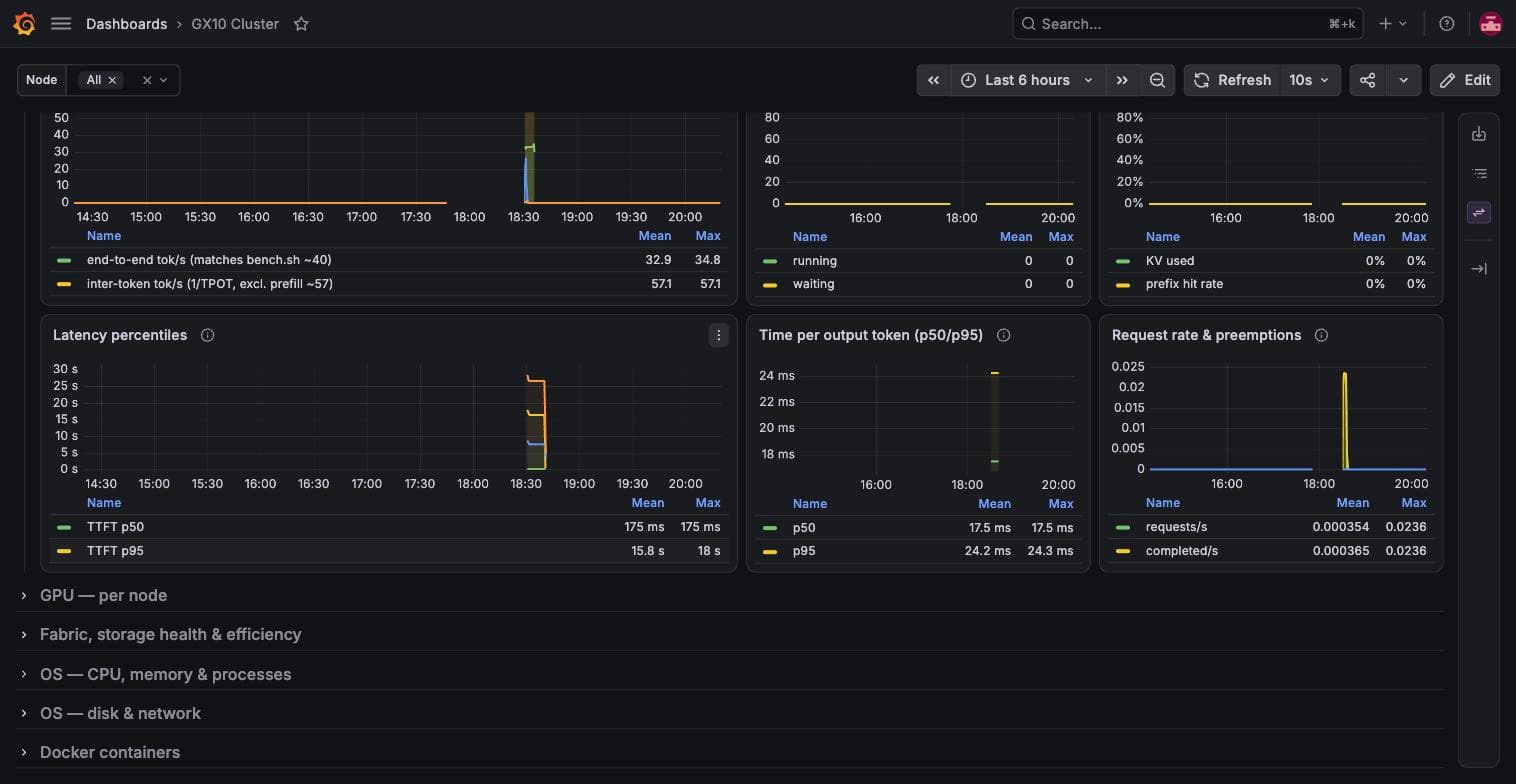 The vLLM row. Two throughput lines that measure different things, and TTFT percentiles that are mostly cold-start artefacts at this request rate.
Those panel names are worth decoding if you have not run a serving stack before. A request has two phases: prefill, where the model reads your prompt in one compute-heavy pass, and decode, where it emits tokens one at a time in the memory-bound loop everything above is about. TTFT is time to first token, so it covers queueing plus prefill. TPOT is time per output token, the decode loop alone. The KV cache is the attention state kept for every token already in the conversation, which is why a longer context costs memory rather than just time.
The throughput panel taught me the most, because it carries two lines. End-to-end averages 32.9 tok/s across that window. Inter-token, which is 1/TPOT with prefill excluded, sits at 57.1. Neither one contradicts the 40.4 from the benchmark: one includes prefill over a mostly idle window, the other measures the decode loop alone. Time per output token reads 17.5 ms at p50 against 24.2 ms at p95.
Worth automating: a script that runs every panel query against Prometheus and flags any that return zero series. Mine caught a panel filtering on mountpoint="/host" when node-exporter strips the --path.rootfs prefix and reports /.
Two things are simply not available on this hardware. Fan speed does not exist: zero tachometers across all seven hwmon devices, and nvidia-smi --query-gpu=fan.speed returns [N/A]. And vllm:estimated_flops_per_gpu_total is permanently 0.0 for this model, so do not build a panel on it.
Does it pay for itself
I wired the cost question into Prometheus rather than guessing, with electricity at 1.04 zł/kWh on a Kraków G11 tariff. One caveat I cannot engineer away: the GX10 has no wall-power sensor, so the 240 W figure for the pair is an assumption, not a measurement.
Over 24 hours of light test traffic the cluster used 5.76 kWh, about 5.99 zł. The same tokens would have cost 9.19 zł on Claude Opus 5 and 18.38 zł on GPT-6 Astra, so it wins there. Against Claude Sonnet 5 at 3.68 zł and Haiku 4.5 at 1.84 zł, it loses, and it loses on every single day that looks like that one.
Break-even against Opus 5 arrives at roughly 0.24 Mtok/day at my input/output mix. The amortisation tile on my dashboard currently reads 58.8 years, which is arithmetically correct and completely meaningless, because it extrapolates a mostly idle machine.
The number that actually matters is concurrency. Single-stream I get 40.4 tok/s, but four concurrent agents aggregate to 115.6 tok/s on the same hardware. Hardware pays for itself through parallel work, not through one fast conversation.
Which leaves an uncomfortable conclusion I would rather state than bury. Against the cheap tier this cluster may never amortise, because those models cost less per token than the electricity to generate them locally. The case for it rests entirely on displacing frontier-tier usage at real volume. A homelab running a few prompts a day is buying privacy and independence, and it should not pretend to be buying savings.


