Table of Contents
Introduction Into Model-Driven Telemetry With Cisco Nexus
When using model-driven telemetry with Cisco Nexus, you’re probably sending sensitive data across your network without using encryption.
By not encrypting your traffic, you’re leaving yourself open to attacks from anyone who may be monitoring your traffic.
Keep on reading to learn how you can implement model-driven telemetry with Cisco Nexus devices and encrypt the traffic.
Over the last few days, I came across the question of how I can secure the connection between my Telegraf instance and my Cisco Nexus device.
The steps are quite simple and in this post, I will walk you through the steps which are needed to configure your Cisco Nexus device and your Telegraf instance.
When we’re finished, you’ll have working and securely encrypted setup to transmit your telemetry data and monitor your network effectively.
Before I get started let me explain the Lab setup that I’m working with:
Lab Setup
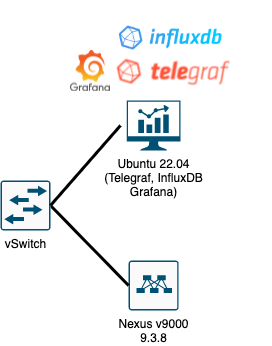
I run two virtual machines on a VMware environment in order to test different Telemetry scenarios on the Cisco Nexus devices.
My current configuration on the Cisco Nexus device looks like this:
Current Telemetry Config
					feature telemetry
telemetry
  destination-profile
    use-vrf management
  destination-group 1
    ip address 172.16.16.254 port 57000 protocol gRPC encoding GPB
  sensor-group 1
    data-source YANG
    path openconfig-interfaces:interfaces
  subscription 1
    dst-grp 1
    snsr-grp 1 sample-interval 10000
I subscribed the openconfig YANG model for interface statistics and sent it out via gRPC with GBP encoded to my Telegraf instance unencrypted.
Then, I analyzed the traffic between the Nexus device and the Telegraf instance with a tcpdump to see what data was being transmitted across the network:
Wireshark unencrypted Payload
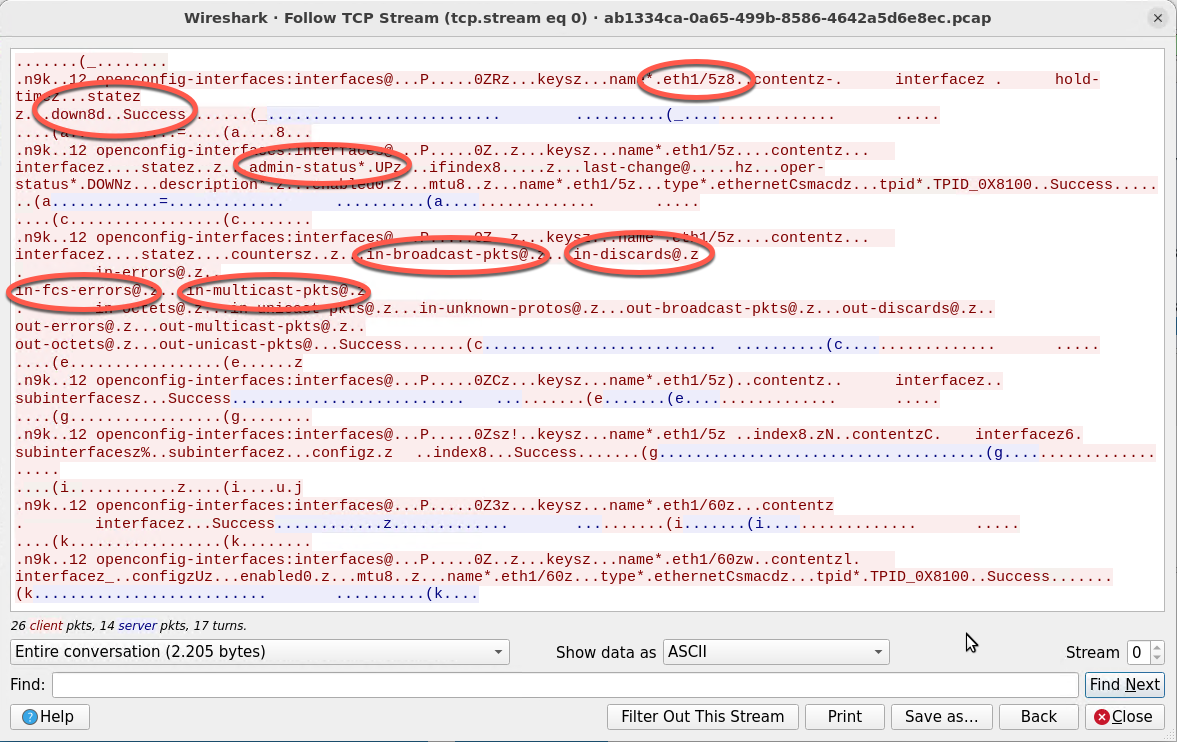
Following one TCP stream in Wireshark shows all the information about the interface’s state (as highlighted in the image above).
This example shows only statistics and interface data, which aren’t exactly critical… however, in worst-case scenarios, attackers would see sensitive data like BGP neighbours if the data model has been subscribed to that dataset.
In those situations, we’d face a big security threat – which we obviously want to avoid (but we still want to use model-driven telemetry with Cisco Nexus).
Therefore, let’s try to improve the configuration and secure the connection with SSL certificates.
Login to your Telegraf instance and run the following commands in order to generate the SSL certificate and copy the certificates to the Telegraf directory:
In my case I used: telegraf
Generate Certificate
					sudo openssl genrsa -out telegraf.key 2048
sudo openssl req -new -x509 -days 365 -key telegraf.key -out telegraf.crt
sudo cp telegraf.* /etc/telegraf/
Edit the Telegraf config file as follows and uncomment/change the certificate statements (see line 6+7):
Add Certificate To The Telegraf Configuration
					 sudo vi /etc/telegraf/telegraf.conf

 [[inputs.cisco_telemetry_mdt]]
  transport = "grpc"
  service_address = "172.16.16.254:57000"
  tls_cert = "/etc/telegraf/telegraf.crt"
  tls_key = "/etc/telegraf/telegraf.key"
Restart the telegraf service and verify that the service is up and running:
					sudo systemctl restart telegraf.service
sudo systemctl status telegraf.service
					 telegraf.service - The plugin-driven server agent for reporting metrics into InfluxDB
     Loaded: loaded (/lib/systemd/system/telegraf.service; enabled; vendor preset: enabled)
     Active: active (running) since Sat 2022-08-06 22:13:28 CEST; 19min ago
       Docs: https://github.com/influxdata/telegraf
   Main PID: 2272686 (telegraf)
      Tasks: 11 (limit: 38397)
     Memory: 66.4M
        CPU: 45.317s
     CGroup: /system.slice/telegraf.service
             └─2272686 /usr/bin/telegraf -config /etc/telegraf/telegraf.conf -config-directory /etc/telegraf/telegraf.d

Aug 06 22:13:29 tig-stack telegraf[2272686]: 2022-08-06T20:13:29Z I! Starting Telegraf 1.21.4+ds1-0ubuntu2
Aug 06 22:13:29 tig-stack telegraf[2272686]: 2022-08-06T20:13:29Z I! Loaded inputs: cisco_telemetry_mdt cpu disk diskio kernel mem processes statsd swap system
Aug 06 22:13:29 tig-stack telegraf[2272686]: 2022-08-06T20:13:29Z I! Loaded aggregators:
Aug 06 22:13:29 tig-stack telegraf[2272686]: 2022-08-06T20:13:29Z I! Loaded processors:
Aug 06 22:13:29 tig-stack telegraf[2272686]: 2022-08-06T20:13:29Z I! Loaded outputs: influxdb prometheus_client
Aug 06 22:13:29 tig-stack telegraf[2272686]: 2022-08-06T20:13:29Z I! Tags enabled: host=tig-stack
Aug 06 22:13:29 tig-stack telegraf[2272686]: 2022-08-06T20:13:29Z I! [agent] Config: Interval:10s, Quiet:false, Hostname:"tig-stack", Flush Interval:10s
Aug 06 22:13:29 tig-stack telegraf[2272686]: 2022-08-06T20:13:29Z I! [outputs.prometheus_client] Listening on http://[::]:9273/metrics
Aug 06 22:13:29 tig-stack telegraf[2272686]: 2022-08-06T20:13:29Z I! [inputs.statsd] UDP listening on "[::]:8125"
Aug 06 22:13:29 tig-stack telegraf[2272686]: 2022-08-06T20:13:29Z I! [inputs.statsd] Started the statsd service on ":8125"
Now it is time to copy the certificate and change the telemetry config on the Cisco Nexus device:
Update Cisco Nexus Device Configuration
The Cisco Nexus device needs to be configured to load the .crt file we just generated and added to Telegraf.
					  copy scp://USER@172.16.16.254//etc/telegraf/telegraf.crt bootflash:telegraf.key vrf management
  show file bootflash:telegraf.crt
  conf t
    telemetry
      certificate /bootflash/telegraf.crt telegraf
Let’s check if the configuration works and we are sending data to the Telegraf instance:
					n9k# show telemetry transport

Session Id      IP Address      Port       Encoding     Transport  Status
--------------------------------------------------------------------------------
0               172.16.16.254   57000      GPB          gRPC       Transmit Error
--------------------------------------------------------------------------------
					   no telemetry
    telemetry
        certificate /bootflash/telegraf.crt telegraf
        destination-profile
            use-vrf management
        destination-group 1
            ip address 172.16.16.254 port 57000 protocol gRPC encoding GPB
        sensor-group 1
            data-source YANG
            path openconfig-interfaces:interfaces
            dst-grp 1
            snsr-grp 1 sample-interval 10000
Let’s check if this workaround is solving the issue:
With “show telemetry data collector details” we can verify if our configured subscription works:
					n9k(conf-tm-sub)# show telemetry transport

Session Id      IP Address      Port       Encoding     Transport  Status
--------------------------------------------------------------------------------
0               172.16.16.254   57000      GPB          gRPC       Idle
--------------------------------------------------------------------------------

n9k(conf-tm-sub)# show telemetry transport

Session Id      IP Address      Port       Encoding     Transport  Status
--------------------------------------------------------------------------------
0               172.16.16.254   57000      GPB          gRPC       Connected
--------------------------------------------------------------------------------
					n9k(conf-tm-sub)# show telemetry data collector details

--------------------------------------------------------------------------------
Row ID         Successful     Failed         Skipped        Sensor Path(GroupId)
--------------------------------------------------------------------------------
0              243            0              0             openconfig-interfaces:interfaces(1)
--------------------------------------------------------------------------------

n9k(conf-tm-sub)# show telemetry data collector details

--------------------------------------------------------------------------------
Row ID         Successful     Failed         Skipped        Sensor Path(GroupId)
--------------------------------------------------------------------------------
0              246            0              0             openconfig-interfaces:interfaces(1)
--------------------------------------------------------------------------------
The “State” is connected and we are sending data!
Now we need the prove and verify with a tcpdump if the device sends out encrypted data:
Wireshark encrypted content
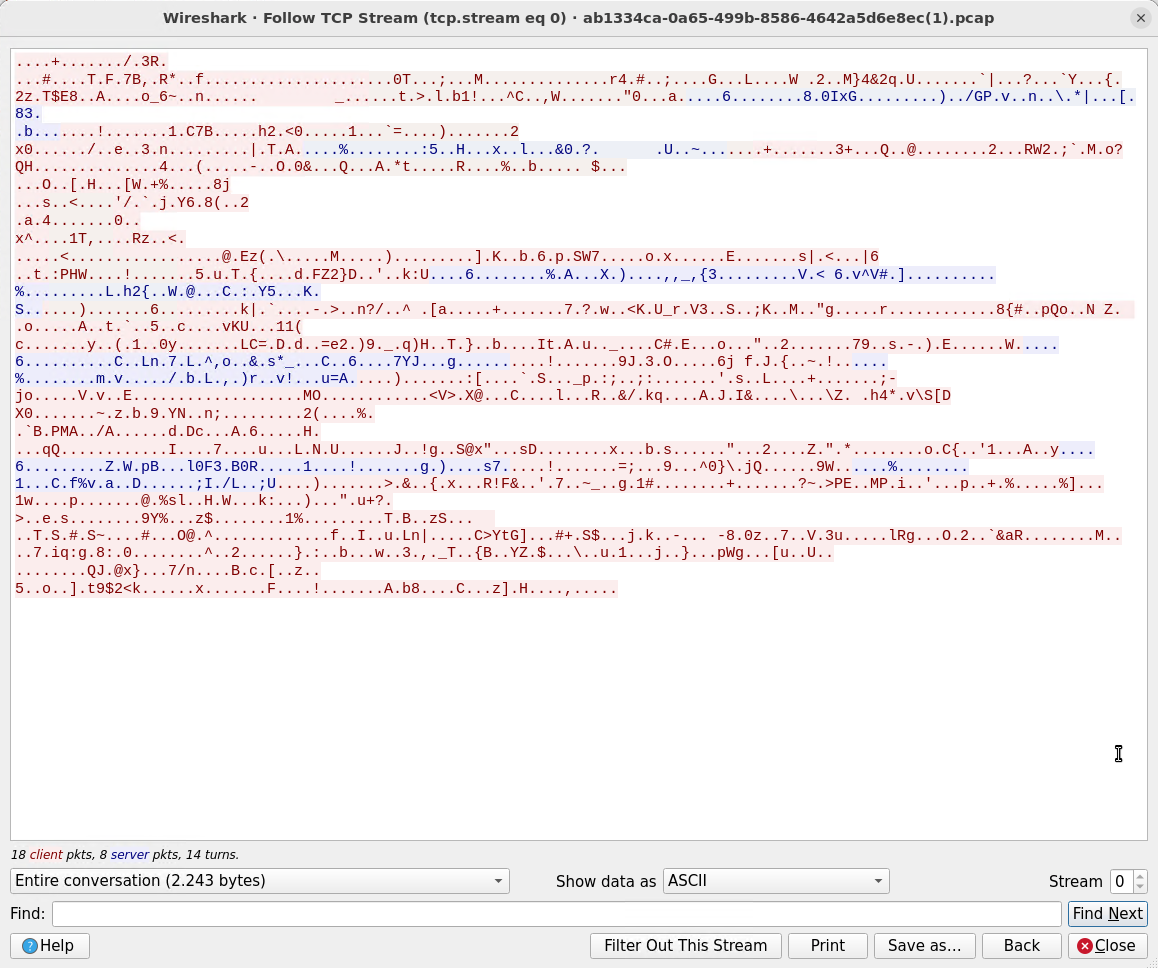
Awesome, the payload is encrypted now!